Conversations
View, analyze, and manage conversations between users and your AI agents.
Overview
The Conversations view provides access to all chat interactions with your agents, enabling you to: - Monitor agent performance in real conversations - Identify common user queries and issues - Review conversation quality - Export conversations for analysis - Debug agent responses
Accessing Conversations
- Navigate to MY AGENTS
- Select your agent
- Click Conversations from the agent menu
The Conversations menu (the conversation list panel on the left) is collapsible — collapse it to free up screen space for the conversation detail view.
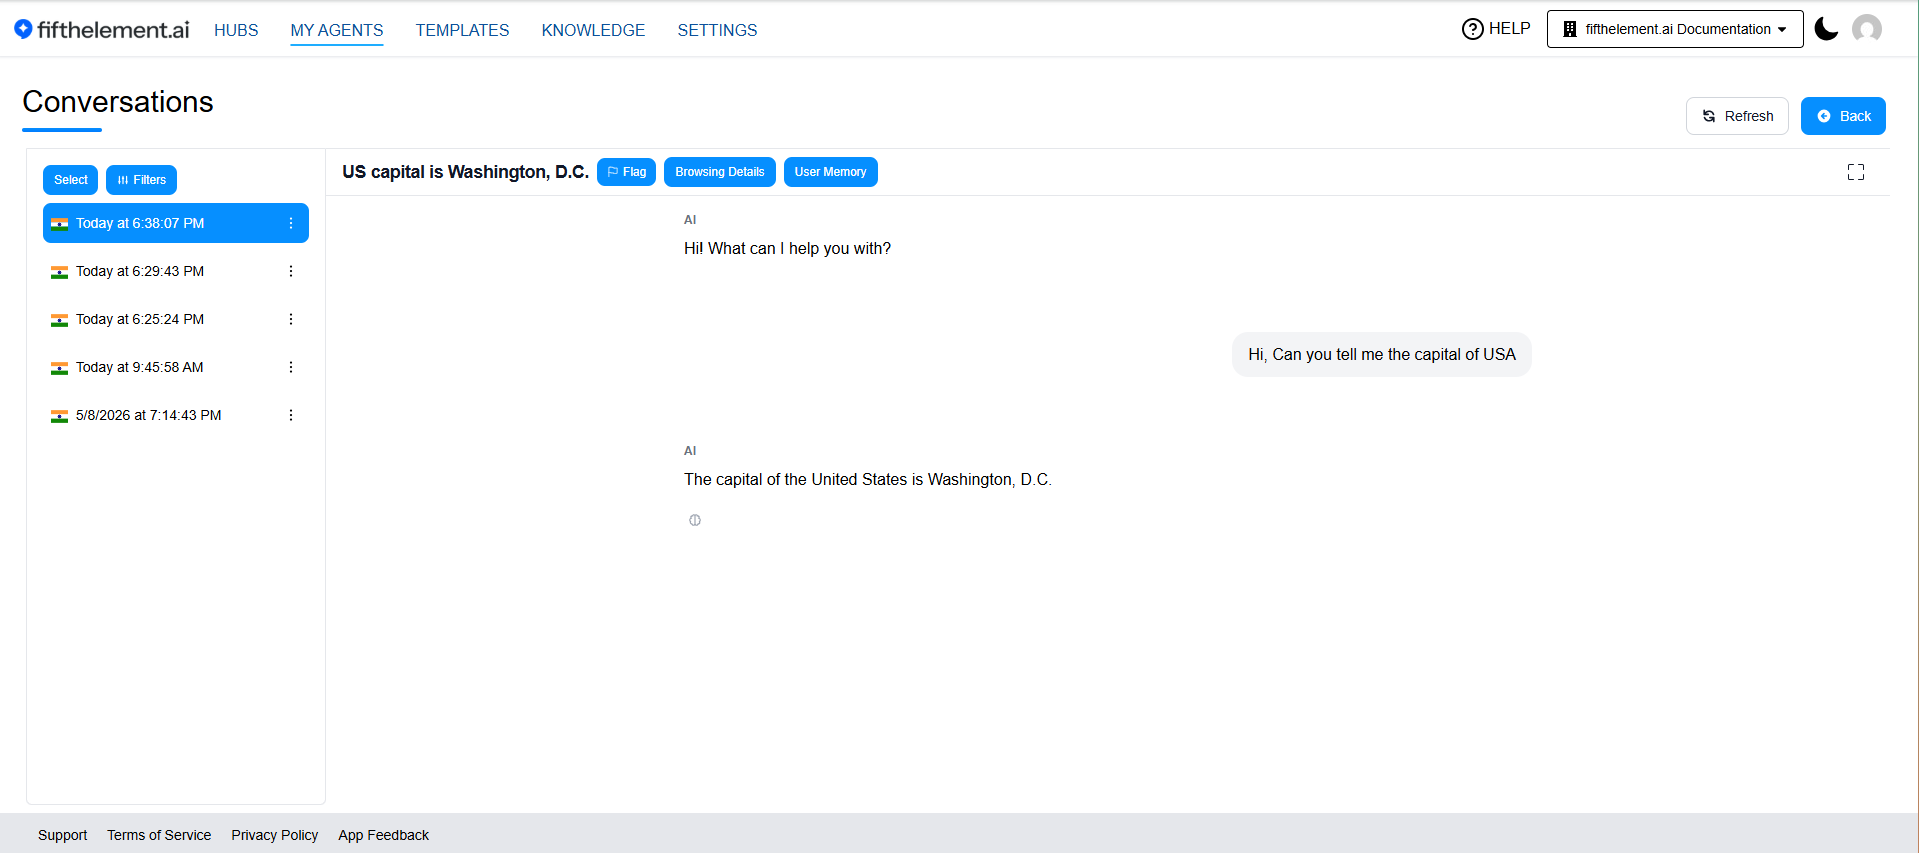
Conversations admin page — the conversation list on the left is the collapsible Conversations menu, and the Show filters button reveals filters that are collapsed by default
Continuous Conversations — No Hard Expiry
Conversations no longer reach a hard, user-visible expiry state. The chat input remains active across long idle periods, and post-processors run iteratively as the conversation continues.
| Concept | Behavior |
|---|---|
| Soft expiry on the backend | When the configured stale period is reached, the backend triggers a soft expiry — Conversation Post-Processors run automatically, generating the initial outcomes (summaries, metadata extraction, CRM updates) just as before |
| Iterative post-processing | If the user resumes the thread later, the new message is appended to the existing context. When the conversation hits the stale period again, post-processors re-run and update / overwrite the previously generated outcomes based on the newly accumulated context |
| User-visible state | The chat input remains active across long idle periods — no "conversation expired" lockout |
Configuration
The stale period is controlled by Conversation Inactivity Duration under the agent's Behavior Flags module (default: 60 minutes). See Post-Processors → Conversation Inactivity Duration.
Replying to Message Feedback
Admins can respond to feedback left on a disliked message, and the user can reply in the same thread.
- Open My Agents, then the agent card's three-dot menu → Conversations.
- Open the conversation and find the message with feedback.
- Choose Reply to feedback to write your response.
- The user sees the response in Feedback Thread when they next open the conversation in the app or embedded widget, and can reply there.
Replies are not delivered live. They cannot be edited or deleted and do not support attachments. Anonymous widget users must return to the same conversation to see the reply.
When message-feedback notifications are enabled, email delivery is best effort. An admin reply can notify the user if an email address is available; a user reply can notify the configured feedback recipients. Configure the recipient-specific email templates under Settings → Templates → Email Template.
Conversation List
Select a conversation from the left panel to open its messages. The current list shows the conversation timestamp and a menu for each entry. The detail header provides Flag, Browsing Details, Analysis and Full screen.
Pinning Favourite Conversations
When to use
Pin the threads you keep coming back to, so they stay at the top of the list instead of scrolling away as new conversations arrive.
Any conversation a user owns can be pinned (favourited) directly from its menu.
| Behaviour | Detail |
|---|---|
| Pin from the conversation menu | Available on any conversation the user owns |
| Pin indicator | Pinned conversations are visibly marked in the list |
| Persists across devices | Pin state is saved to the account, so it survives sessions and follows the user between devices |
Filtering Conversations
Filters appear collapsed by default behind the Show filters button (visible in the Conversations Page Layout above). Expand to reveal the controls below.
The expanded panel provides Search Conversations, Date, User ID, Filters and Analysis. Use the control that matches the data you need; available analysis fields depend on the agent’s configured post-processors.
Analysis Filter
A new Analysis option under Filters lets you slice conversations by any Analysis (After The Conversation) field and value. The value is free text, works on a contains-match, and is case-insensitive — e.g., filter by conversation Type: Sales to surface every conversation the analyzer tagged as a sales chat.
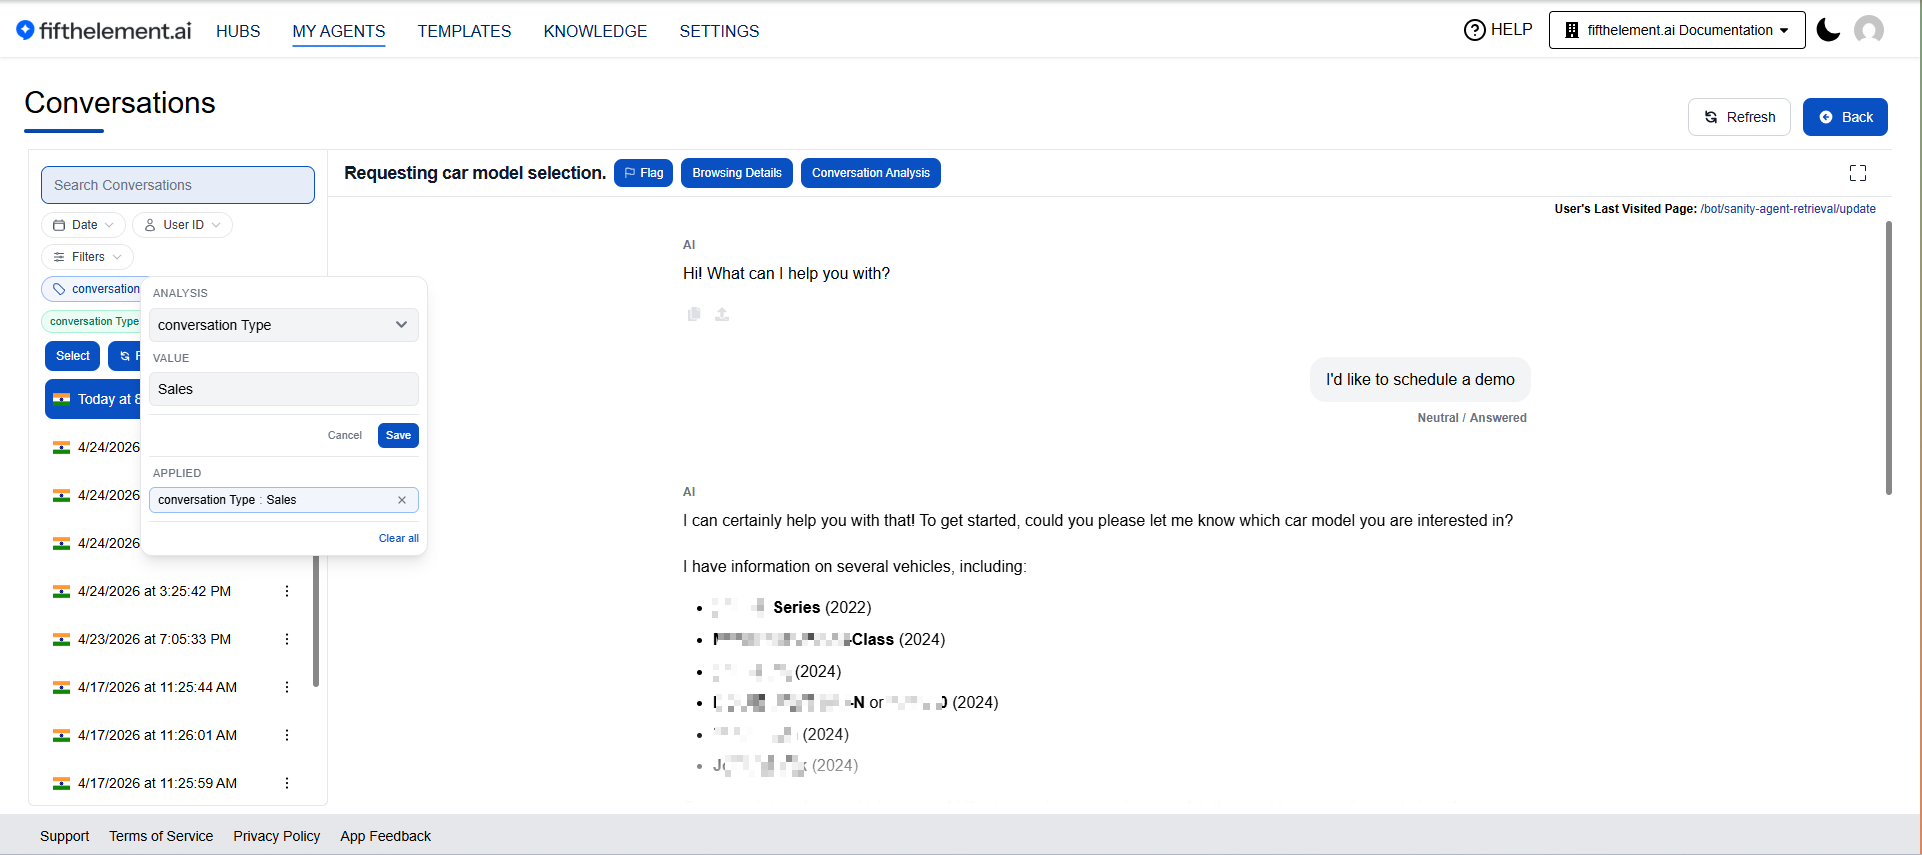
Analysis filter — pick an Analysis field (e.g., conversation Type), enter a free-text value (e.g., Sales), and Add. Applied filters appear as removable chips below
See Post-Processors → Analysis (After The Conversation) for how the underlying fields are configured.
Conversation Analysis — Per-Conversation Post-Processor Inspection
Click the conversation’s Analysis button on any conversation to view every post-processor that ran on it, with:
- Status — Ready, Processing, or Failed
- Extracted values — fields and JSON output from each analyzer / summary run
- Error details — if a post-processor failed
- Last-updated timestamps — most recent run for each post-processor
This makes analyzer outputs actionable at the individual conversation level, not just in aggregate reports.
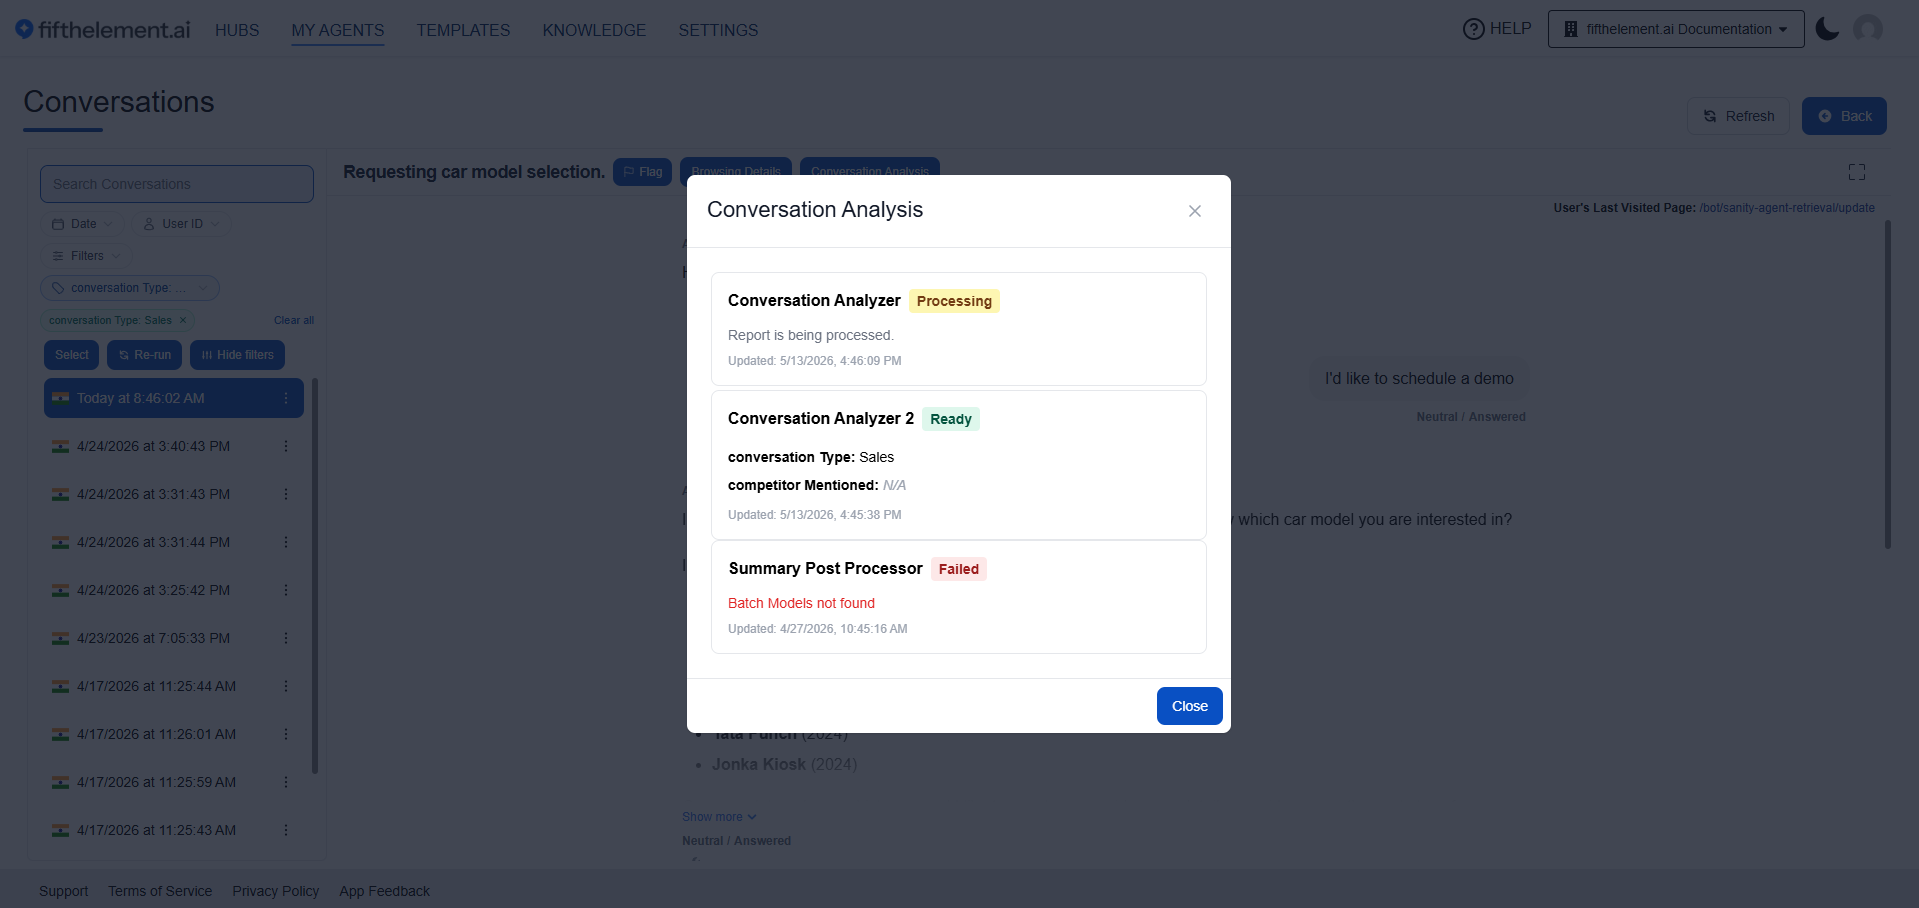
Conversation Analysis modal showing three Ready results, including extracted fields and a conversation summary.
Conversation Observability — Debug Info
A unified Debug info panel surfaces everything that happened on a conversation turn — the language model that produced the reply, the pre-processors that ran (with the tags they applied), the tools called, the memory state used, the raw request trace, and the request's stop reason. Diagnose truncated or off-looking responses directly instead of guessing.
Where to find it
Open Debug info via the info (ⓘ) icon next to any agent turn, on both:
- The View screen (live chat) — full panel including the Request Trace section
- The Conversations admin screen — all sections except Request Trace
What it shows
| Section | What's captured |
|---|---|
| Language Model | The model used for the turn (e.g., Gemini 3.1 Pro), status (Completed / Running / Failed), and TTFT (time-to-first-token) |
| Pre-Processors | Each pre-processor that ran on the turn, with status and timing. Tags applied by these processors flow downstream and are surfaced here too |
| Tools | Each tool invocation — name, status (Completed / Running / Failed), and timing. Useful for spotting slow or erroring tools |
| Tags Applied | The tags attached to that turn, listed alongside it |
| Token Counts | Input and output token counts for the turn |
| Memory | The user/context memory state for the turn. Shows: At Message Time (snapshot when the user's message landed), Current (live state — may have been edited since), and the Memory Map (raw memory contents). An "Edited since" badge appears if memory has changed since the turn — Copy buttons let you snapshot each block |
| Request Trace (View screen only) | The raw JSON request sent to the model — metaData, prompt turns, etc. Not persisted: closing the page or navigating away drops it |
| Stop Reason (in Debug Logs) | Per-call stop reason (e.g., STOP, MAX_TOKENS) alongside request/response headers, response body, and timing. Available from the separate Debug Logs view |
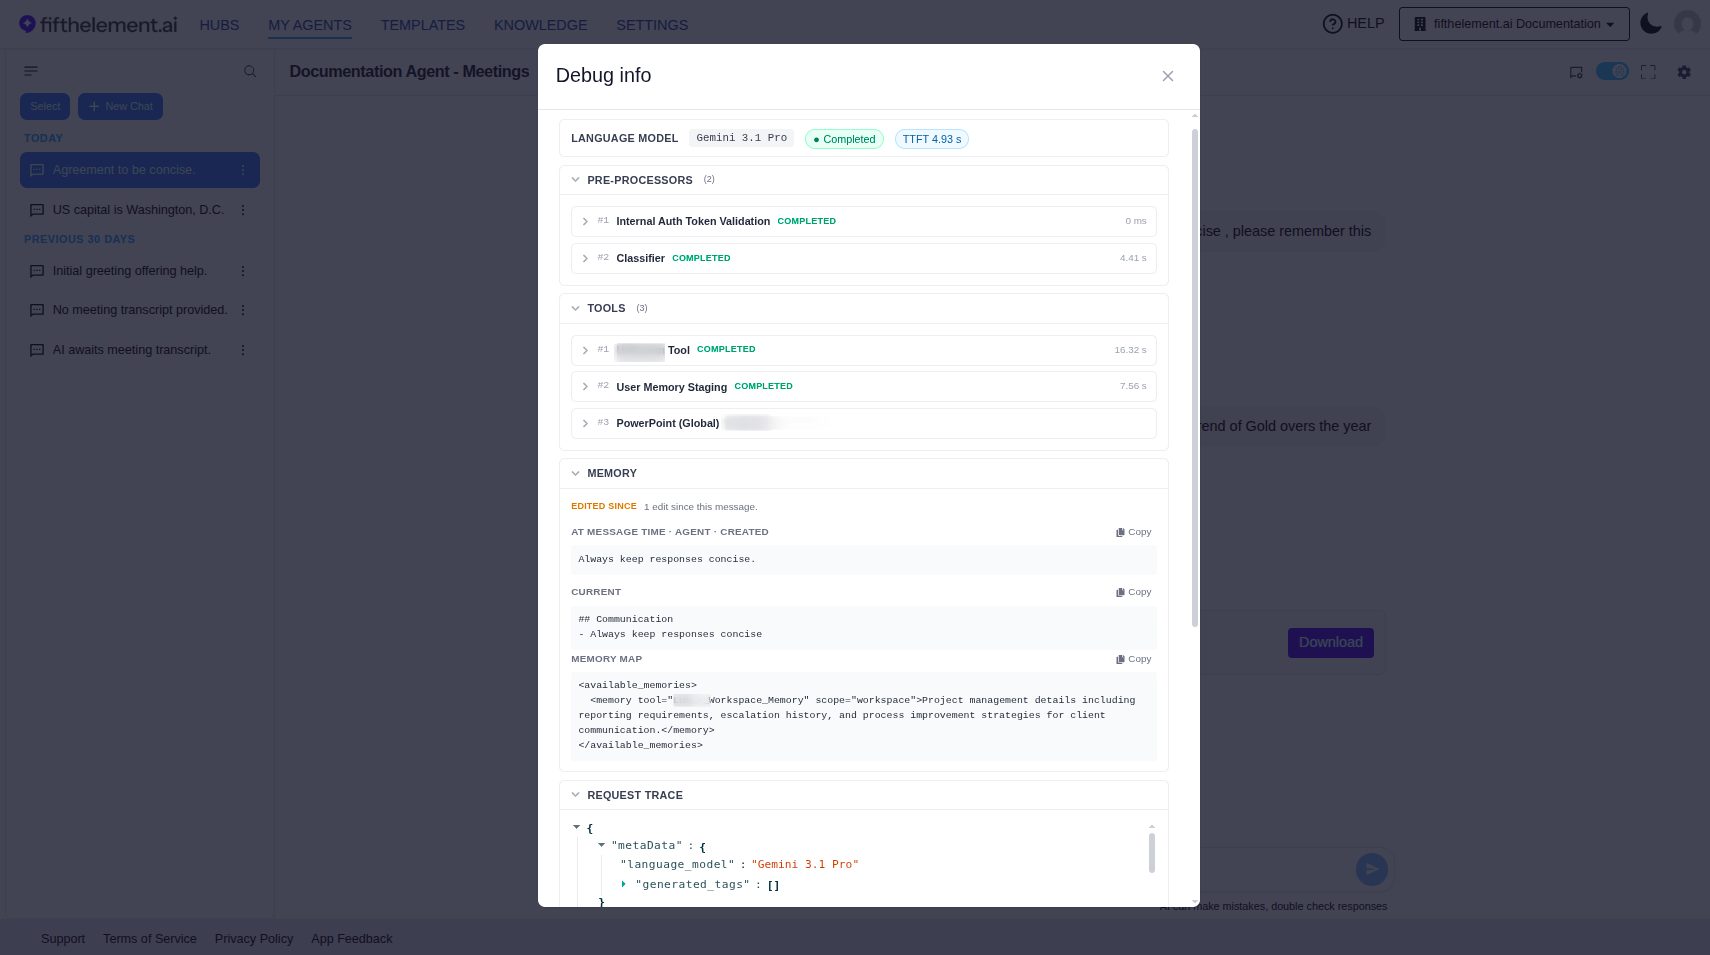
Debug info for an existing example turn: model, stop reason, TTFT, input/output tokens, and expanded pre- and post-processor status/timing. Available sections depend on the turn.
Debug Logs — per-call wire detail
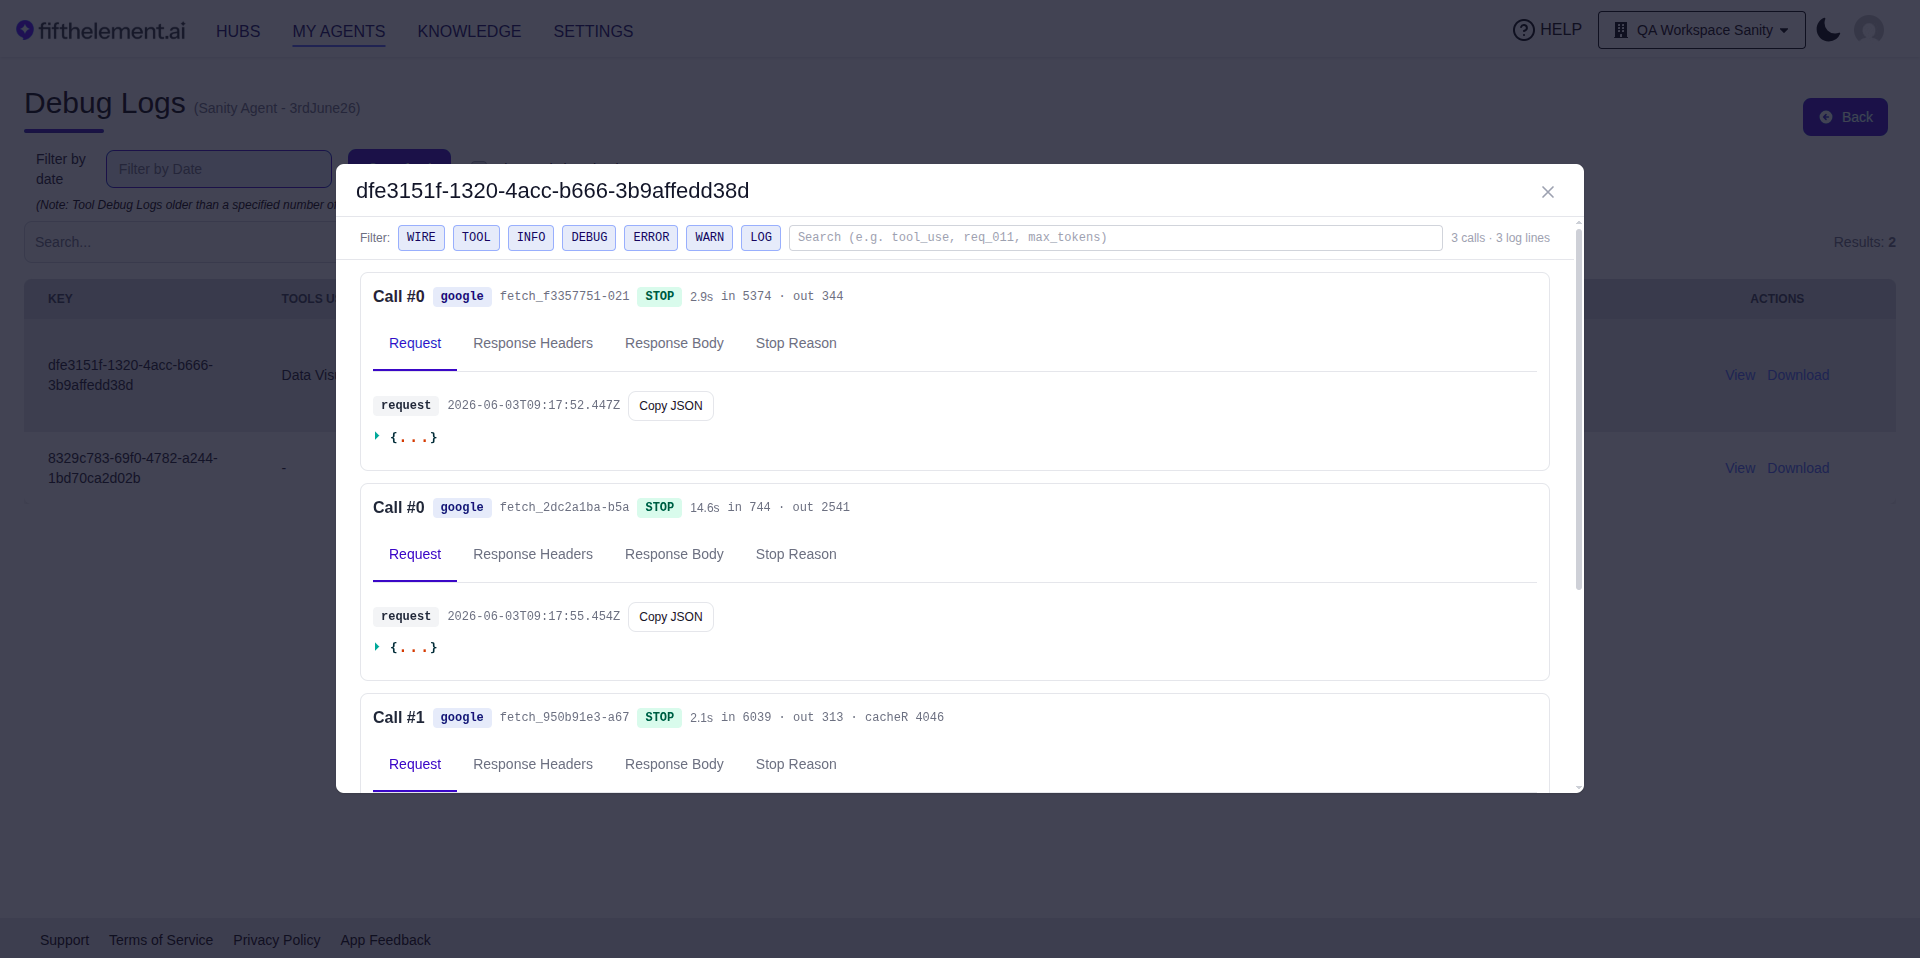
The companion Debug Logs view captures the raw provider-level calls behind each turn, with per-call stop reason alongside full request/response wire details. Open My Agents > agent menu > Request Debug Logs; each entry expands into one or more Calls showing:
- Provider (e.g.,
google) and request ID (e.g.,fetch_f3357751-021) - Stop status (e.g.,
STOP) and timing (e.g.,2.9s,in 5374/out 344tokens, optionalcacheR 4046for cached reads) - Tabs: Request · Response Headers · Response Body · Stop Reason
- Request timestamp + a Copy JSON action
The log list provides Filter by Date, Refresh, Show only logs having errors and a text search. Log details depend on the selected record.
Current Debug Logs list with date, error-only and search controls. This example agent has no retained records.
Retention
Tool Debug Logs older than a configured retention window are pruned automatically. Use the View / Download actions on each log row to inspect or archive entries before they age out.
Access — existing Debug permission
Debug info is gated by the existing Debug permission in the agent role editor — the Debug capability under Agent > Beyond the editor in the current role matrix, which controls debug-mode access in the chat (e.g., Show Context Sent to API). No new permissions were introduced for this surface.
- Admins have Debug by default
- Any other role granted the Debug capability sees the ⓘ icon and can open Debug info on both the View and Conversations screens
Different from the original 1.0.34 release notes
The original 1.0.34 release notes described two separate observability surfaces (Tool-Call Traces and Memory Observability) with a tiered RBAC model (Admin: both; Workspace Admin/Supervisor: tool only) — and proposed adding new Memory Observability and Tool Call Observability permissions to the role editor.
The 1.0.34-P1 patch superseded that with the unified Debug info panel above, and the proposed new permissions were dropped — access reuses the existing Debug permission instead.
When to use
- Truncated response? Check the Stop Reason in Debug Logs —
MAX_TOKENSmeans the model hit its output limit; raise the language model's Max Output Tokens. - Wrong-feeling tool behavior? Inspect the Tools section — confirm the right tool fired and check its timing for slowness.
- Memory not picked up? Compare At Message Time vs Current memory — the "Edited since" badge tells you whether the answer was grounded in an older state.
- LLM not behaving as expected? Open the Request Trace on the View screen to see the exact payload sent to the model (system prompt + turn history + generated_tags + metadata).
Viewing Conversation Details
Click on a conversation to view:
Message Thread
- Complete conversation history
- User messages
- Agent responses
- System messages (escalations, errors)
- Timestamps for each message
Metadata
- Session ID
- User information (if available)
- Agent version used
- Models invoked
- Tools called
- Response times
Analytics
- Average response time
- Tool usage count
- Knowledge base queries
- Tokens consumed
- Cost per conversation
Conversation Actions
Export Conversation
Export individual conversations in multiple formats: - JSON: Full conversation data with metadata - PDF: Formatted conversation transcript - CSV: Tabular message data - Text: Plain text transcript
Share Conversation
Share conversation links with team members: 1. Click Share button 2. Copy shareable link 3. Set access permissions (view only, edit) 4. Set expiration (optional)
Flag for Review
Flag conversations that need attention: - Quality issues - Agent errors - Inappropriate responses - Training opportunities
Add Notes
Add internal notes to conversations: - Document context - Note follow-up actions - Tag team members - Link related conversations
Bulk Actions
Select multiple conversations to: - Export in bulk - Tag for categorization - Delete (compliance) - Archive
Search Conversations
Search across all conversations:
Full-text Search - Search message content - Find specific keywords or phrases - Use quotes for exact matches
Advanced Filters - User ID - Agent version - Date range - Message count - Response quality
Conversation Analytics
Aggregate Metrics
- Total conversations
- Average messages per conversation
- Average conversation duration
- Completion rate
- Escalation rate
- User satisfaction score
Trends
- Conversations over time
- Peak usage hours
- Common topics
- Escalation patterns
Privacy & Compliance
Data Retention
Review the workspace's Data Purge Settings before relying on older conversations or report data. A value shown in an example workspace is not a platform-wide retention default. Confirm your organization's retention and deletion requirements with its administrator.
User Privacy
Use synthetic conversations when preparing examples or support evidence. Remove personal details, credentials and private document content before sharing screenshots or logs. See DLP Policies for policy configuration; do not assume a configured policy covers every channel or exported record.
Access Control
Review the member's effective workspace role and scope before granting conversation access. A visible control in an administrator screenshot does not establish that every role can use it.
Troubleshooting
Conversation Not Showing
Issue: Recent conversation not visible in list
Solution: - Refresh the page - Check date range filter - Verify user has proper permissions - Allow 1-2 minutes for conversation to sync
Cannot Export Conversations
Issue: Export button is grayed out or fails
Solution: - Verify you have export permissions - Check if conversations contain PII (may require admin approval) - Try smaller date range (large exports may timeout) - Contact support if issue persists
Best Practices
Regular Reviews
- Review conversations weekly
- Identify patterns and common issues
- Use insights to improve agent instructions
- Flag excellent interactions for training
Quality Assurance
- Sample conversations randomly for QA
- Check agent adherence to instructions
- Verify tool usage is appropriate
- Ensure knowledge base retrieval is accurate
User Feedback
- Monitor satisfaction ratings
- Follow up on low-rated conversations
- Incorporate feedback into agent improvements
- Thank users for positive feedback
Related Topics
- Agent Reports - Aggregate analytics and metrics
- Agent Builder - Improve agent based on conversation insights
- Version Control - Track changes to agent configuration